Contact us

Arkhos Center, 2100 Westheimer Ridge, Houston, TX 77056

+1 (713) 555-0142

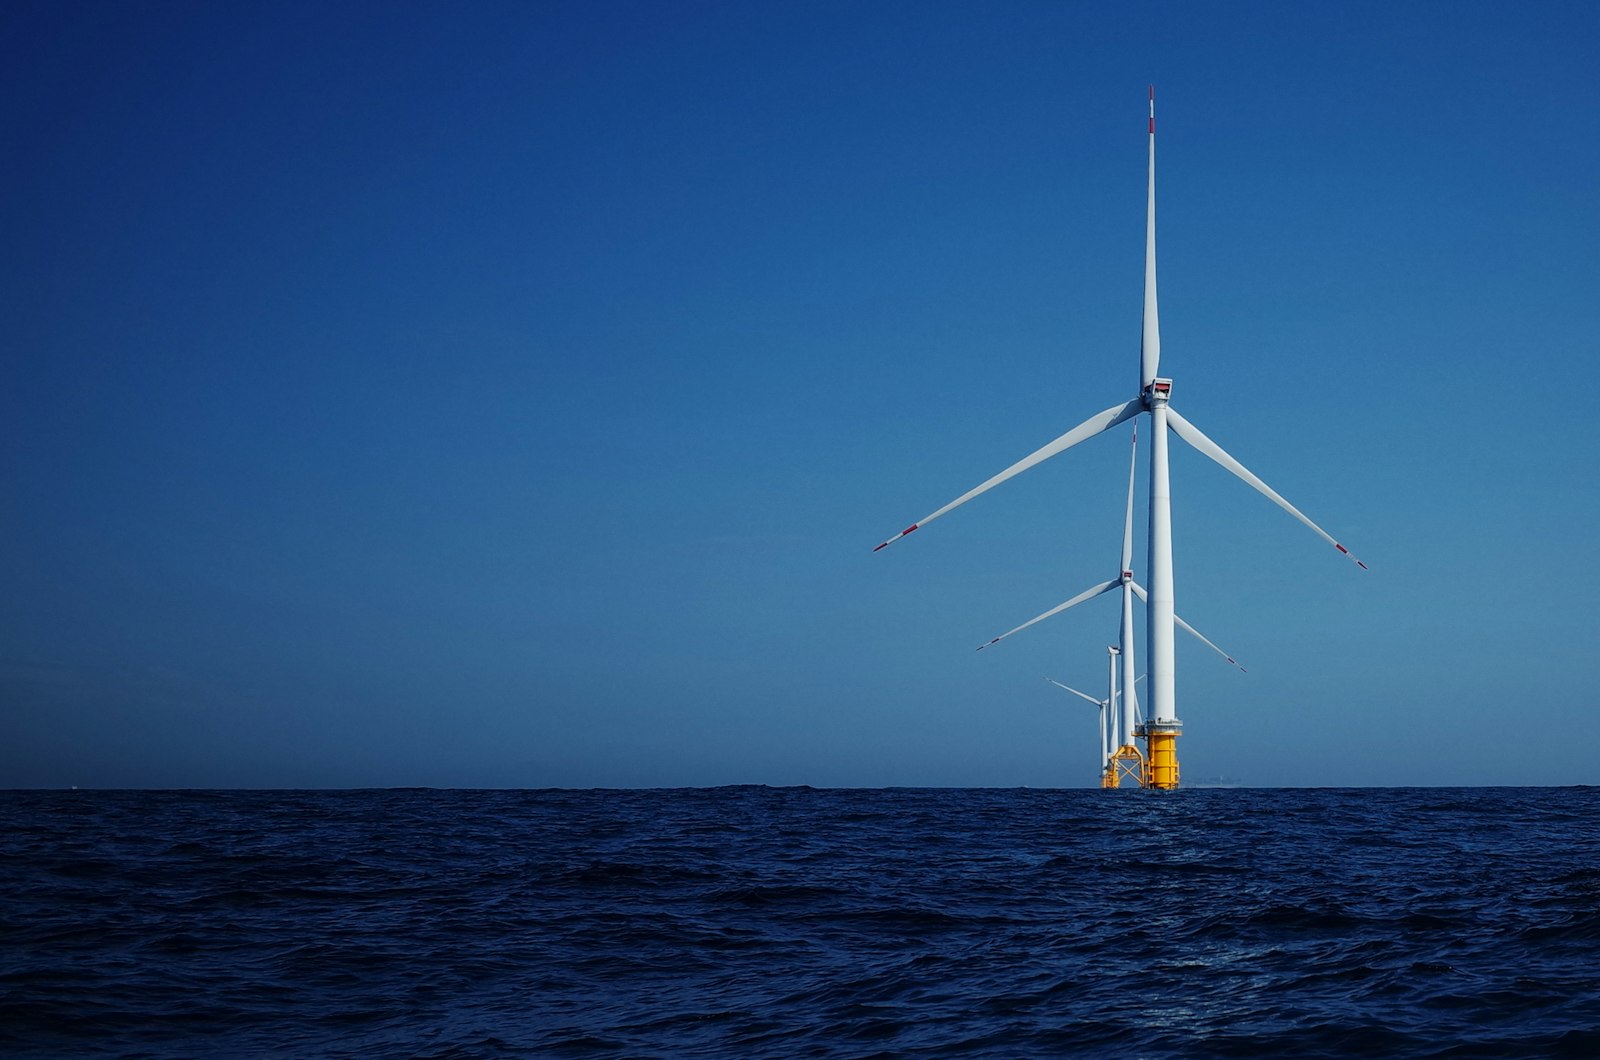
Offshore wind turbines standing in open sea under a clear blue sky
  1. Home
  2. Sustainability

Lower emissions today. New energy for tomorrow.

We are cutting the emissions from every barrel we produce, and building carbon storage, renewable power and low-carbon fuel businesses alongside our oil and gas.

−41%Operated intensity since 2016
0.07%Methane intensity, 2025
86%Less routine flaring
$1.6 bnLow-carbon investment, 2025

Three pillars, each with a number we report every year.

Our Climate Transition Plan 2026 sets out how we halve operated emissions intensity by 2030 and reach net zero operated Scope 1 and 2 emissions by 2050. Shareholders backed it with 89% of votes at the 2026 AGM.

Read the full plan

Decarbonise our operations

Most of our operated emissions come from three sources at production sites: power generation, flaring and methane. We are working on all three at once.

  • ElectrifyTern Field switches to power from shore in 2027, and electric frac fleets already run at Basalt Ridge.
  • Find and fix methaneContinuous sensors on our Permian pads, plus quarterly satellite and drone surveys of every operated asset.
  • End routine flaringEvery new development captures or reinjects its gas. Halcyon FPSO reinjects 100% of associated gas.

−41% since 2016

Operated Scope 1 and 2 intensity. Our target is −50% by 2030.
Grow low-carbon businesses

We invest where our skills in the subsurface, in large projects and in energy trading give us an advantage over new entrants.

  • Store carbonSkerry Point injects 5 Mtpa of CO₂ from 2027. We aim for 10 Mtpa of storage capacity by 2035.
  • Generate clean power400 MW of solar and 200 MWh of batteries at Duqm, plus a 30% stake in the 1.1 GW Baltic Wind farm.
  • Make lower-carbon fuelsPort Arden produces 20 kbbl/d of renewable diesel from waste fats and used cooking oil.

$1.6bn in 2025

Low-carbon investment, 11% of capital spending. Rising to 18% by 2030.

Partner for systemic change

Our operated emissions are a small part of the energy system. We work with partners, customers and governments on the larger part.

  • Raise standards in joint venturesMethane and flaring clauses go into every non-operated joint venture we sign or renew.
  • Serve industrial customersWe offer CO₂ transport and storage to cement, chemicals and hydrogen plants in Scotland and northern England.
  • Support sound policyWe back carbon pricing and direct methane regulation, and publish a yearly review of our trade associations.

14associations

Industry bodies reviewed for climate-policy alignment in 2025. We left one.

Baseline year
2016
Intensity target
−50% by 2030
Long-term target
Net zero by 2050
Linked to pay
20% of bonus
Project screening price
$45/bbl Brent
Capital, 2026–2030
$38 bn

Operated emissions are down 38% since 2016, and the pathway to 2030 is set.

Absolute Scope 1 and 2 emissions from the assets we operate, on a 100% operated basis. Select a year in the chart to see what moved the number.

Operated Scope 1 and 2 emissions Mt CO₂e

The full data for this chart is in the table below.

Scope 1, 2025
17.2 Mt CO₂e
Scope 2, market-based
2.5 Mt CO₂e
Change since 2016
−38.1%
Scope 3, use of sold products
131 Mt CO₂e
View data
Operated Scope 1 and 2 emissions by year, actual and pathway, in million tonnes of CO₂ equivalent
YearMt CO₂evs 2016StatusMain driver
201631.8–ActualBaseline year for all our climate targets.
201731.2−1.9%ActualLeak detection and repair rolled out across US onshore assets.
201830.1−5.3%ActualFlare gas recovery installed on the Heron Deepwater FPSO.
201929.4−7.5%ActualFirst electric frac fleet at Basalt Ridge, and the sale of two high-intensity onshore assets.
202026.8−15.7%ActualLower activity during the pandemic and fewer well completions.
202125.9−18.6%ActualElectric frac fleets extended across Basalt Ridge.
202224.1−24.2%ActualContinuous methane monitors and zero-bleed controllers on every Basalt Ridge pad.
202322.6−28.9%ActualWaste-heat recovery and new furnaces at the Bayshore refinery.
202420.9−34.3%ActualHalcyon FPSO starts up with all associated gas reinjected.
202519.7−38.1%ActualRoutine flaring down 86% on 2016.
203015.9−50.0%PathwayTern power from shore, zero routine flaring and methane below 0.05%.
20500.0−100%PathwayNet zero operated Scope 1 and 2 emissions.

Scope 1 and 2 data for 2016 to 2025 received limited assurance under ISAE 3000 (Revised) and ISAE 3410. Pathway values show the absolute emissions implied by our 2030 intensity target at planned production and by our 2050 net zero target. They are targets, not forecasts.

Low-carbon portfolio

Five projects built on skills we already have.

Carbon storage uses our reservoir engineers. Offshore wind uses our marine construction teams. Renewable diesel runs through a refinery we already operate.

All projects
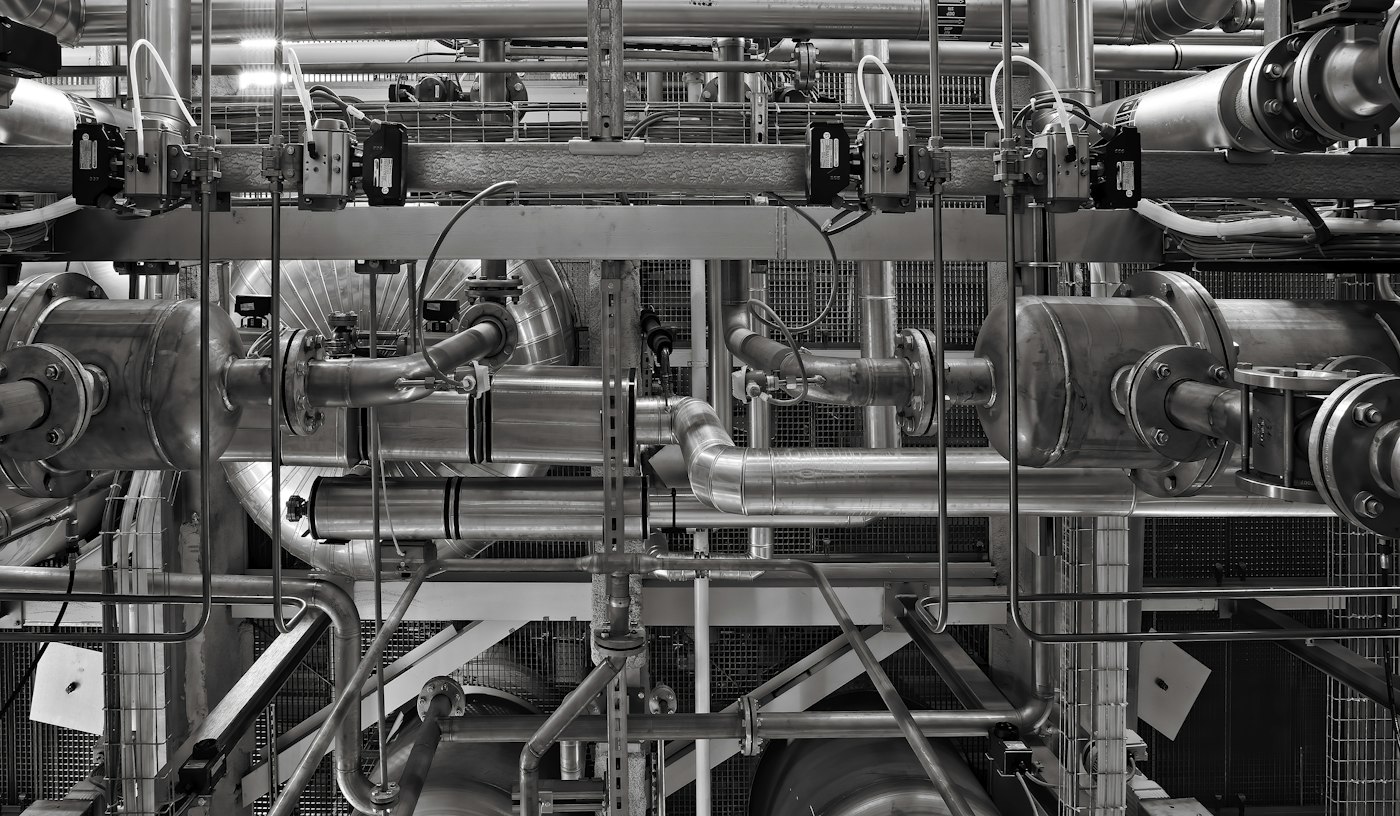
Close view of industrial pipework, valves and gauges
In constructionCCS

Central North Sea, UK 57°36′N 0°54′E

Skerry Point CCS

Phase one takes CO₂ captured at industrial sites in Scotland and northern England and stores it 2,600 metres below the seabed, in a depleted gas reservoir we produced for 22 years. We took the final investment decision on 14 October 2026.

Phase one 5 Mtpa CO₂Injection 2027Storage depth 2,600 mPartners 3
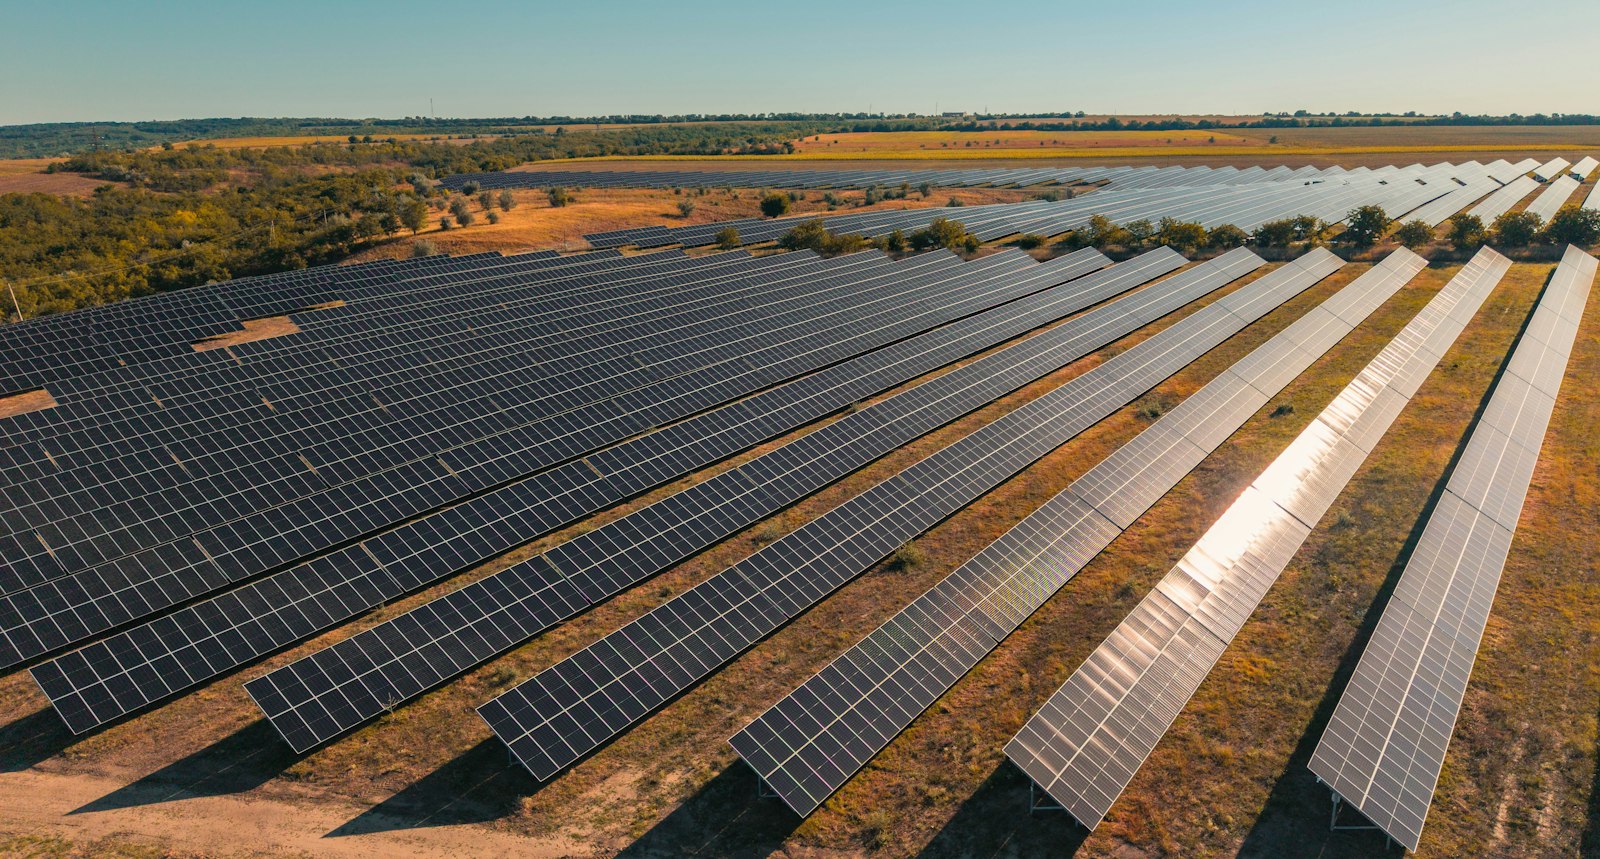
Aerial view of long rows of solar panels across open country
OperatingSolar

Al Wusta, Oman 19°36′N 57°42′E

Duqm Solar + Storage

Solar power by day and battery power after dark run our Oman facilities and replace gas-fired generation.

Solar 400 MWBattery 200 MWhAvoided 430 kt CO₂/yr
Open sea at sunset with the sun on the horizon
In constructionWind

Southern Baltic Sea 54°54′N 14°36′E

Baltic Wind JV

A 30% stake in a 73-turbine offshore wind farm, with power contracted to our Port Arden refinery.

Capacity 1.1 GWTurbines 73 × 15 MWPower 2028
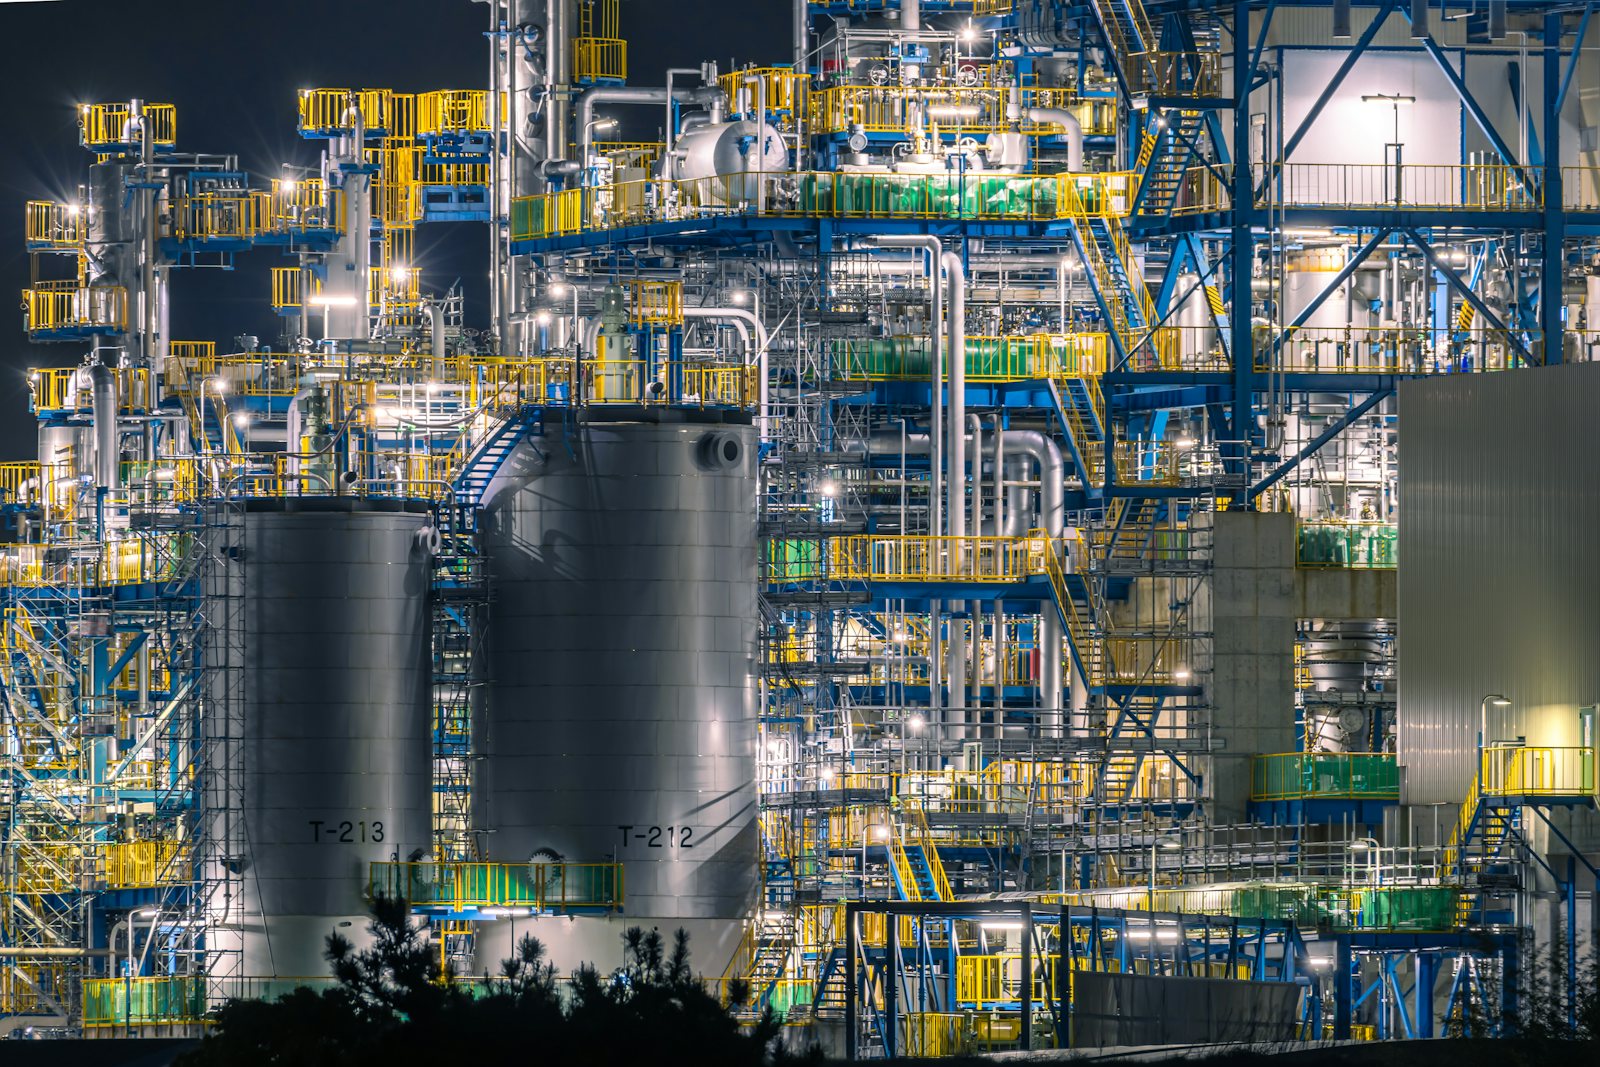
Refinery columns and tanks lit up at night
OperatingFuels

Rotterdam, Netherlands 51°57′N 4°06′E

Port Arden renewable diesel

A converted hydrotreater turns waste fats and used cooking oil into diesel with up to 80% lower lifecycle emissions.

Capacity 20 kbbl/dOnline 2021Feedstock Waste oils
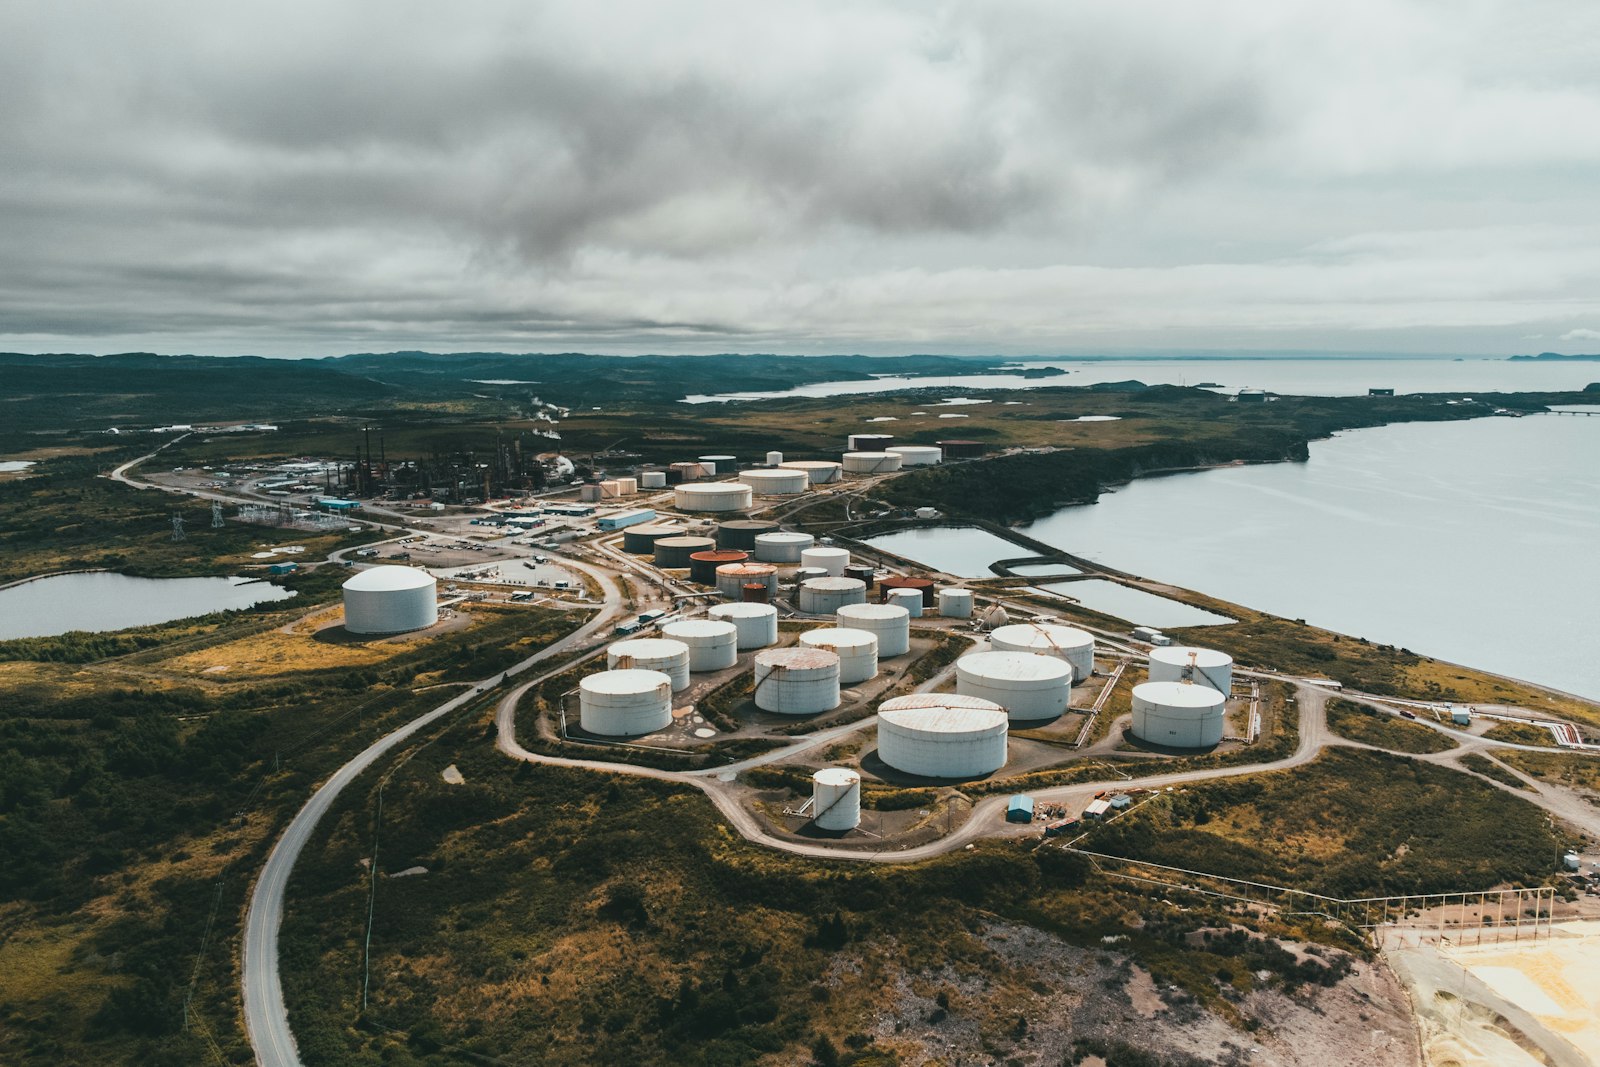
Aerial view of a coastal industrial site with storage tanks
FEEDCCS

Coastal Bend, Texas, USA 27°44′N 97°08′W

Gulf Coast storage hub

Our second CO₂ store, in saline sandstone 2,100 metres below Texas state waters, taking CO₂ from Bayshore and neighbouring plants.

Phase one 3 Mtpa CO₂FID target Q4 2027Anchor Bayshore
Low-carbon capex, 2025
$1.6 bn
Net renewable capacity
534 MW
CO₂ storage target, 2035
10 Mtpa
Renewable diesel
20 kbbl/d

Less fresh water, more land restored, and no operations in the most protected places.

Many of our assets sit in dry places, from the Permian Basin and the Pilbara to the deserts of Abu Dhabi and Oman. Water and land are where neighbours feel our footprint first.

Sand dunes at dawn with the sun low over the horizon
Arid-basin operationsHigh water stress

We measure water at basin level and set site targets wherever the WRI Aqueduct tool rates water stress as high or extremely high. Treated produced water replaces fresh water wherever the chemistry allows, and every new onshore development is designed to need no fresh water for completions.

On land and at sea we follow the mitigation hierarchy: avoid, minimise, restore, then offset. Every producing hub runs a biodiversity action plan with a named owner. Since 2020 we have restored land from plugged well pads in West Texas and British Columbia to mangrove belts near our Heron Deepwater supply base in the Niger Delta.

Freshwater withdrawn, 2025
37.9 million m³
Assets in high water-stress basins
6
Biodiversity action plans
14 of 14 hubs

−22% since 2019

Freshwater withdrawal across all operated assets

68%

Produced water recycled or reinjected in 2025

1,450ha

Land and coastline restored since 2020

0sites

Operations in IUCN category I–IV protected areas or natural World Heritage sites

Everyone home safe, and more of the value kept where we work.

We recorded zero fatalities in 2025 across 21,400 employees and our contractors. In host countries we buy locally, train local crews and fund programs chosen with the community.

Safety

0.19TRIR

Recordable injuries per 200,000 hours worked in 2025

Communities

$84million

Social investment in host communities in 2025

Communities

62% local

Local share of supplier spend in host countries

Workforce

38% women

Share of women in our 2025 graduate intake

Lost-time injury frequency
0.05
Fatalities, 2025
0
Employees
21,400
Nationalities
92

Stories from our host communities

More in the newsroom

Climate governance

Who is accountable, how they are paid, and who checks the numbers.

Climate risk is a Board responsibility at Arkhos. Targets sit in executive scorecards, data is independently assured, and our portfolio is tested against low-price and low-demand scenarios every year.

We test every major project against a world that meets the Paris goals, and we publish what we find.
Margaret Ellison
Chair of the Board
Board oversight

The Board's Safety, Environment and Climate Committee is chaired by an independent director and met six times in 2025. It reviews progress against each 2030 target every quarter and screens every project above $250 million against our emissions pathway before it reaches the full Board. The full Board approves the transition plan each year.

Pay linked to targets

20% of the annual bonus for the Chief Executive Officer and the executive team depends on emissions intensity, methane and flaring results. A further 15% of the three-year performance share award is tied to low-carbon capital spending and progress toward the 2030 intensity target.

Third-party assurance

An independent assurer provides limited assurance over our Scope 1, 2 and 3 emissions, methane intensity, flaring and water data under ISAE 3000 (Revised) and ISAE 3410. We are moving Scope 1 and 2 to reasonable assurance from the 2026 reporting year.

Scenario analysis at $45 Brent and IEA scenarios

Every new project must earn its cost of capital at $45/bbl Brent. We also test the whole portfolio against the IEA Stated Policies, Announced Pledges and Net Zero Emissions by 2050 scenarios, using a carbon cost that reaches $160/t CO₂e by 2040 in advanced economies. In the net zero case, upstream portfolio value falls by 9% and no producing asset stops before the end of its planned life.

Advocacy and trade associations review

Each year we compare the climate positions of the industry associations we belong to with our own. In 2025 we reviewed 14. Eleven were aligned and two were partly aligned, and we are working with those two on specific policies. One was misaligned on methane regulation, so we left it. The full review is published with our Climate Transition Plan.

Everything we report, in one place.

Our reports follow IFRS S2, the TCFD recommendations, GRI 11 for the oil and gas sector and the SASB standards. Data covers every asset we operate.

ARKHOS ENERGY 2025

Sustainability Report

Lower emissions today. New energy for tomorrow.

Published 9 Apr 2026118 pages
  • PDF

    Sustainability Report 2025

    Our full performance on climate, water, nature, safety and communities.

    12.3 MB
  • PDF

    Climate Transition Plan 2026

    Targets, levers and capital allocation to 2030 and 2050. Backed by 89% of shareholder votes.

    6.1 MB
  • PDF

    ISSB/TCFD Report 2025

    Governance, strategy, risk management and metrics, with scenario results at $45 Brent.

    3.8 MB
  • XLSX

    ESG Data Sheet 2025

    Ten years of emissions, energy, water, safety and workforce data by asset.

    410 KB
  • PDF

    Human Rights Report 2025

    Salient risks, supply chain due diligence and grievance cases in our host countries.

    2.2 MB
  • IFRS S2
  • TCFD
  • GRI 11
  • SASB EM-EP
  • OGMP 2.0

Questions about our reporting

See the projects that will carry the plan to 2030.

From carbon storage under the North Sea to solar power in Oman, every project we sanction must meet our emissions pathway and pay back at $45 Brent.